It’s May 16th, 2020, and there’s an undeniable feeling of optimism in the US about Covid-19. A vibe that we’ve got this thing on the run. All over the country businesses are opening up and we’re getting ready for Summer.
I feel like I must be missing something. We all see the same data but to me it looks anything but reassuring. The current numbers look like a failure and a setup for a calamity in the fall.
The conclusion I’ll outline below could be wrong—I hope it’s wrong—but when you look at the larger context it’s such an obvious inference that even if it is wrong, it seems like it should be the default conclusion that the uninformed jump to, the one that people in the know contemptuously debunk, as they do when someone says that “it’s no worse than the flu.” So right or wrong, either way, something seems off.
To see why it looks so bad to me, consider a couple of points first.
In What Sense Is Covid-19 Under Control?
First of all, the widespread conviction that the epidemic is winding down in the US is itself a mystery.
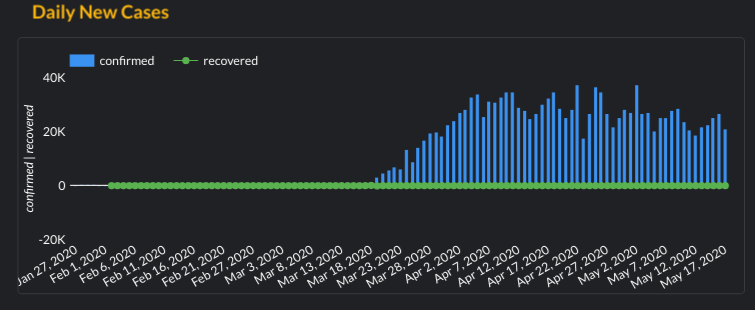
The stay-at-home orders, mask wearing, social distancing and such were supposed to flatten the curve and indeed, that’s what happened. When the curve flattened sometime around April 5 there were 33,913 cases per day. The local peak over the last few days was May 16, at 26,576/day which is 0.78 of the maximum. If you cut the data this way we’re only down by 0.22. It tilts down a little, but it’s almost flat. (The mortality graph looks very similar.)
You could argue that putting the whole country in one graph hides what’s really happening because the epidemic did not hit everywhere at the same time. Some of the most severely affected states like NY and NJ, where it broke out earliest, are down by half. It could be that the states where it broke out later are only going up because the arc of the epidemic in those states was offset by a few weeks. It’s not a ridiculous argument, but even if it’s true it concedes that everything the country has done for ten weeks only pushed it down to half the peak. That’s well short of what I’d call a rout.
The graph above is for the whole country but you can get details galore from Goh Kok Han’s interactive data dashboard.
It’s Under Control Elsewhere—It Can Be Done
A whole slew of countries have gotten the rates down to almost zero. At least one (New Zealand) seems to have completely eradicated it. It can certainly be done. The thing is, you have to actively root it out. Some people staying indoors in some urban areas is not sufficient. You have to go after every case.
Covid-19 is an ILI
We have a practical problem in that we aren’t attempting to root it out case by case, but we have a logical problem too: it makes no sense to draw conclusions about how we’re doing based on trends in the daily new-case rate alone. You have to consider the context.
Covid-19 is an influenza-like illness (an ILI, as the professionals say) and the ILI’s are notoriously seasonal. Check out the graph below.

We don’t know for sure that Covid-19’s graph will be like this because the disease only arrived here when the ILI season was over for 2020, but since the very name ILI means that it’s flu-like, we should assume it will act like the flu. Not to belabor the point, deciding that we’re successfully suppressing Covid-19 based on data collected between late March and mid-May is like estimating annual snowfall based on data collected in that same period.
The graph shows a very tight pattern. The peaks are different heights from year to year but regardless of the size of the peak, both the timing of the season and the off-peak rates are strikingly tightly grouped.
- The ILI season takes off in early October.
- The rates go up rapidly until sometime between Christmas and New Years the drop off.
- The entire ILI season is about 16-18 weeks.
- By the beginning of March it’s mostly over and by April 1 the ILI rates are below the average for the year.
- The infection rates hit rock bottom in August or September but by mid May (where we are right now) they are getting pretty close to that minimum level.
Last Call
Now we get to the reason the current numbers seem so alarming. The epidemic didn’t even arrive here until the ILI season was almost over yet it exploded exponentially anyway. By the time we flattened the curve, the normal, garden variety ILI new case rates were already below the average rate over the year.
Actually, even the Chinese and European efforts to suppress the virus took place when the winds of nature were at their backs. ILI season was already at its peak and ready to decline when the first cases occurred in China and the early European cases came even later.
The current numbers don’t represent a victory. They’re not even encouraging. This is the ILI off-season and the current rate of death from Covid-19 would kill 135,000 people if it persisted for a three month ILI season. (The worst ILI season in recent history was 86,000 for an entire year.)
What If?
What if Covid-19 had shown up before the ILI season started instead of as it was ending? What kind of peak new-case rates would have been consistent with the Covid-19 rates we are seeing now in mid-May?
I’m about to speculate, but unless a miracle happens and a vaccine is invented, goes through several rounds of testing, is approved by the FDA, and is manufactured and distributed in time to inoculate a few hundred million people before the late Autumn, we are probably going to find the answer empirically.
If you assume that the arc of Covid-19’s will be similar to the arc of the garden variety ILI’s, then you should be able to extrapolate a decent answer from the 10 weeks of cases that we have, right?
Unfortunately, for many reasons, you can’t rely on an answer computed that way. It’s at best a way to get a ballpark idea of what is a plausible range. The first problem is that we can’t be certain that Covid-19 will act exactly like the other ILI’s. It could be relatively more or less seasonal. Another problem is that the ILI rates for those ten weeks are the result of the ILI season tapering down from its peak while the actual Covid-19 numbers represent the virus starting flat footed from a handful of cases when one would assume even an established virus would be struggling. A third problem is that Covid-19’s exponential increase was transformed into a plateau by a nationwide effort to suppress it. No such effort was made for the ordinary ILI’s during the years of the graph. The first of these problems could affect the result in either direction, but the last two suggest the estimate will be too low, possibly much too low.
Prognosis for ILI Season
Nobody is going to make public policy on the basis of this blog post so let’s ignore these problems and simply pretend that the Covid-19 rate for the last 10 weeks is comparable to the ILI rate for the same period and that the curves will be similar except for size. We’re also assuming the measures in place in the fall will be roughly as effective as what we’ve done so far.
- Looking at the areas under the ILI curves, we see that perhaps five or six times as many ILI cases occur during the ILI season as occur between the 12th week and the 22nd week of the year.
- Those 10 weeks saw 88,000 Covid-19 deaths.
- Five or six times that total would put the dead during the 18 weeks of a flu season somewhere between 86,000*5=430,000 and 86,000*6=516,000 with perhaps another thirty percent more fatalities in the off-season periods
So our ballpark estimate is about half a million deaths during the ILI season and 150,000 during the rest of the year for at total of 2/3 of a million deaths in the first year. To me it looks like half a million dead between November and February is a reasonable expectation but twice that number does not seem crazy given the major factors we ignored. Half that many would not be completely crazy either because we don’t know that the Covid-19 is as seasonal as the normal ILI’s. It’s possible that Covid-19 is indifferent to whatever it is that throttles down the ordinary ILI’s after the new year and Covid-19 in January won’t be so much worse than in April.
Therefore, anything from a quarter million to a million or more deaths during the coming ILI season (in addition to the background ILI deaths) would not be surprising.
One More Thing
The level of expense resulting from the anti-Covid-19 measures is almost certainly a one-time thing. It has done unprecedented damage to the economy and to the economic lives of many millions of people. At least thirty-eight million people are unemployed. Countless businesses large and small will not survive; people’s life savings and dreams of retirement are in those sinking businesses. College educations are being disrupted and many will not be resumed. Mortgages will be defaulted on, cars will be repossessed, millions just barely making it will be making it no longer. People who now live in houses could easily end up living in refrigerator boxes on the sidewalk.
The country can’t do this indefinitely and it probably won’t attempt it again. Our national will to continue is clearly ebbing even now.
The upshot is that our estimate may have been made with a stacked deck. The death-toll on which we based it was held down to an unknowable degree by an effort we may not be able or willing to match when ILI season rolls around again late in the year. America may simply refuse to do the holiday season on Zoom, especially with the President and many governors barely convinced that the epidemic is a serous threat.
Conclusion
These dire predictions are nonsense if Covid-19 turns out not to have the annual cycle typical of ILI’s. But if we choose to assume that it is and ILI like the other ILI’s, we should consider our options.
Developing a vaccine would be great, but few knowledgeable people think it could happen before the ILI season starts ramping up in five months. Relying on herd immunity is absurd—infection of roughly 5% of the population has already resulted in nearly 100k dead. If it takes 70% to achieve herd immunity that’s 1.4 million people dead. For scale, that is half as many as die of everything else put together during a normal year. Nor can we all simply stay home binge watching Netflix for years. The only practical thing to do is the laborious approach of identifying every case and tracking down and isolating everyone they have been in contact with.
Tracing contacts and isolating them is only practical if we first wrestle the new case numbers down to a reasonable level and we have the ability to test millions of people per day, people ready to trace contacts for every positive result and the bureaucratic resources in place to handle it all. Getting ready is a stupendous organizational task. If it were being done we’d be hearing about it.
One measure of our supine indifference is that people who suspect they have it are officially advised to simply stay home unless they have symptoms of pneumonia. They aren’t advised, let alone required, to alert the authorities; if there is even a mechanism to do so, it has not been well publicized, nor does there seem to be any procedure for following up with testing and tracing.
The tide turns in late August. After that the new-case count accelerates inexorably.
We could stamp out the virus, but so far our national resolve has been unimpressive. Actually, we’re currently doing the opposite of wrestling the numbers down—much of the country is opening up as fast as it can. I’m in Northern New Jersey and I just saw an ad by the state of Maryland imploring us to visit their beaches because things are getting back to normal. We still don’t have adequate testing, we still can’t provide PPE to people who desperately need it, let alone to the general public. There doesn’t seem to be much of a plan for identifying, tracing and isolating. We’ve squandered months already and we’re starting to slip backwards just when we should be taking advantage of the Summer minimum to stamp this out. It’s looking grim for this Winter.
